
Kit Integration Guide
Introduction
Kit (formerly ConvertKit) is an email marketing platform trusted by thousands of food bloggers and content creators. The Phynite Analytics Kit Integration brings your email marketing analytics together with your website analytics in one unified dashboard.
Why connect Kit to Phynite Analytics?
- Unified Analytics Dashboard: View both website and email performance in one place
- Track Campaign Effectiveness: Monitor open rates, click rates, and subscriber engagement
- Data-Driven Decisions: Use insights to optimize your email marketing strategy
- Save Time: No more switching between multiple platforms
- Understand What Resonates: See which campaigns drive the most traffic to your website
- Optimize Subject Lines: Discover which subject lines generate the highest open rates
Getting Started
Requirements
Before connecting your Kit account, make sure you have:
- An active Kit (ConvertKit) account (free or paid)
- A Phynite Analytics account with completed setup
- A dataset configured in Phynite Analytics
Note: All Kit account types are supported, though analytics features may vary based on your Kit plan level.
Connecting Your Kit Account
There are two ways to connect your Kit account to Phynite Analytics.
Option 1: Connect from the Phynite Dashboard
- Log into your Phynite Analytics account.
- Click your profile icon → Profile.
- Scroll to Connected Services.
- Find Kit (ConvertKit) and click Connect.
- Log into your Kit account and click Authorize.
- You’ll be redirected back to Phynite with a success message.
- Go to Dashboard → Email → Kit to view your analytics.

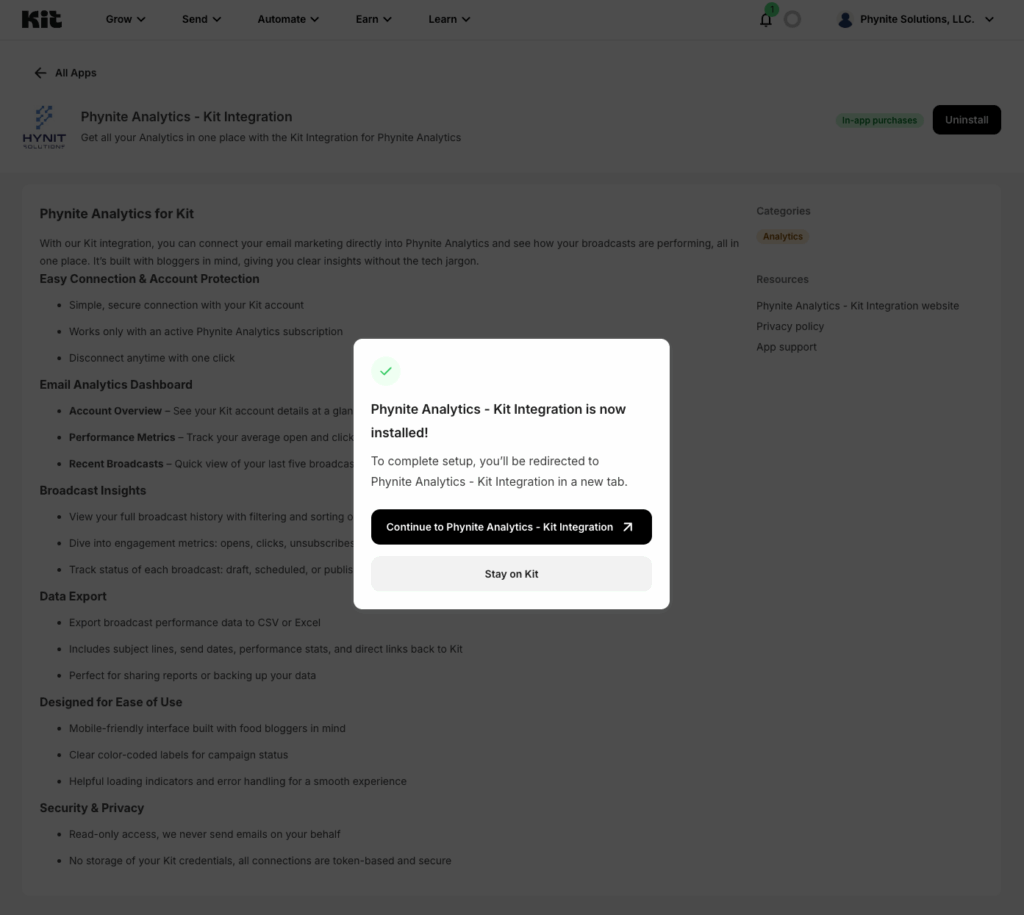
Option 2: Install from the Kit App Store
- Open your Kit dashboard.
- Navigate to the Kit App Store.
- Follow the prompts and authorize your Kit account.
- Return to Phynite Analytics to see your email analytics.
What You Can Do with the Kit Integration
Email Analytics Dashboard
Access: Dashboard → Email → Kit
Your dashboard shows:
- Average Open Rate
- Average Click Rate
- Average Recipients
- Total Clicks
- Account Information (name, email, plan type)
Pro Tip: Use this to identify which types of subject lines and content consistently perform best.
Broadcast Performance Analytics
Access: Dashboard → Email → Kit → View All Broadcasts
View and sort performance for each email broadcast, including:
- Subject line
- Send date and status (Published, Scheduled, Draft)
- Open rate, click rate, recipients, unsubscribes, bounces, and delivery rate
Sort by date, status, open rate, or click rate.
Filter by All, Published, Scheduled, or Drafts.

Export Broadcast Data
Export your analytics for deeper analysis:
- Go to Dashboard → Email → Kit → Broadcasts
- Filter broadcasts as needed
- Click Export → CSV or Export → Excel (.xlsx)
Includes: subject line, send date, status, open/click rates, recipients, and delivery data.
Tip: Export monthly to track trends or share data with your team.
Understanding Your Metrics
Open Rate
Shows how many recipients opened your email.
Formula: (Opens ÷ Recipients) × 100
Good Benchmark: 15–25% for food bloggers
Ways to improve:
- Test subject lines
- Send at optimal times
- Keep your sender name consistent
Click Rate
Shows engagement with your links.
Formula: (Clicks ÷ Recipients) × 100
Good Benchmark: 2–5%
Ways to improve:
- Use strong CTAs
- Feature your best content
- Keep links above the fold
Delivery Rate
Formula: ((Recipients − Bounces) ÷ Recipients) × 100
Aim for 95% or higher.
Clean your list regularly to maintain high deliverability.
Unsubscribe Count
Normal range: 0.1–0.5%
If higher, reduce email frequency or adjust content relevance.
Requirements & Limitations
You’ll need:
- Active Kit account (free or paid)
- Active Phynite Analytics subscription
- Dataset configured
Access & Security
- Read-only access — Phynite never sends emails
- Secure OAuth 2.0 authentication
- Tokens encrypted and expire every 6 months
Managing Your Connection
View connection status: Profile → Connected Services → Kit
Status indicators:
✅ Connected ⚠️ Expired ❌ Disconnected
To reconnect:
Click Reconnect Kit Account when prompted and reauthorize.
Takes under 30 seconds.
To disconnect:
Dashboard → Integrations → Kit → Disconnect
Disconnecting removes Phynite’s access but doesn’t delete your Kit data. You can reconnect anytime.
Troubleshooting
Kit Connection Expired Message
Click Reconnect Kit Account and reauthorize. Tokens expire every 6 months for security.
Broadcasts Not Showing Analytics
Drafts and scheduled emails don’t have analytics until they’re sent.
Recently sent broadcasts may take 5–10 minutes to update.
Connection Failed During Setup
- “Dataset ID required” → Complete your dataset setup first
- “Authorization failed” → Log into the correct Kit account
- “Redirect mismatch” → Try again or contact support
Slow Loading Times
Initial loads fetch data from Kit’s API — subsequent loads are cached.
Use filters or export data for large datasets.
Frequently Asked Questions
Do I need a paid Kit account?
No. Free accounts work too. Paid plans unlock advanced analytics.
Can Phynite send emails through Kit?
No. Phynite only reads analytics — it never sends emails or changes your Kit account.
Can I connect multiple Kit accounts?
Each Phynite property can connect one Kit account.
Is my data secure?
Yes — OAuth 2.0, encrypted token storage, HTTPS, and read-only permissions ensure full security.
How often is data updated?
We sync data from Kit once every hour.
What’s Next
Now that Kit is connected:
- Explore analytics in Dashboard → Email → Kit
- Identify your top-performing broadcasts
- Track trends in open and click rates
- Export data for deeper analysis
- Use insights to improve your strategy
Pro Tips for Food Bloggers:
- Compare email performance with website traffic
- Test subject lines with or without emojis 🍪
- Send holiday or seasonal roundups
- Watch unsubscribe rates to manage frequency
- Export monthly to monitor long-term growth