
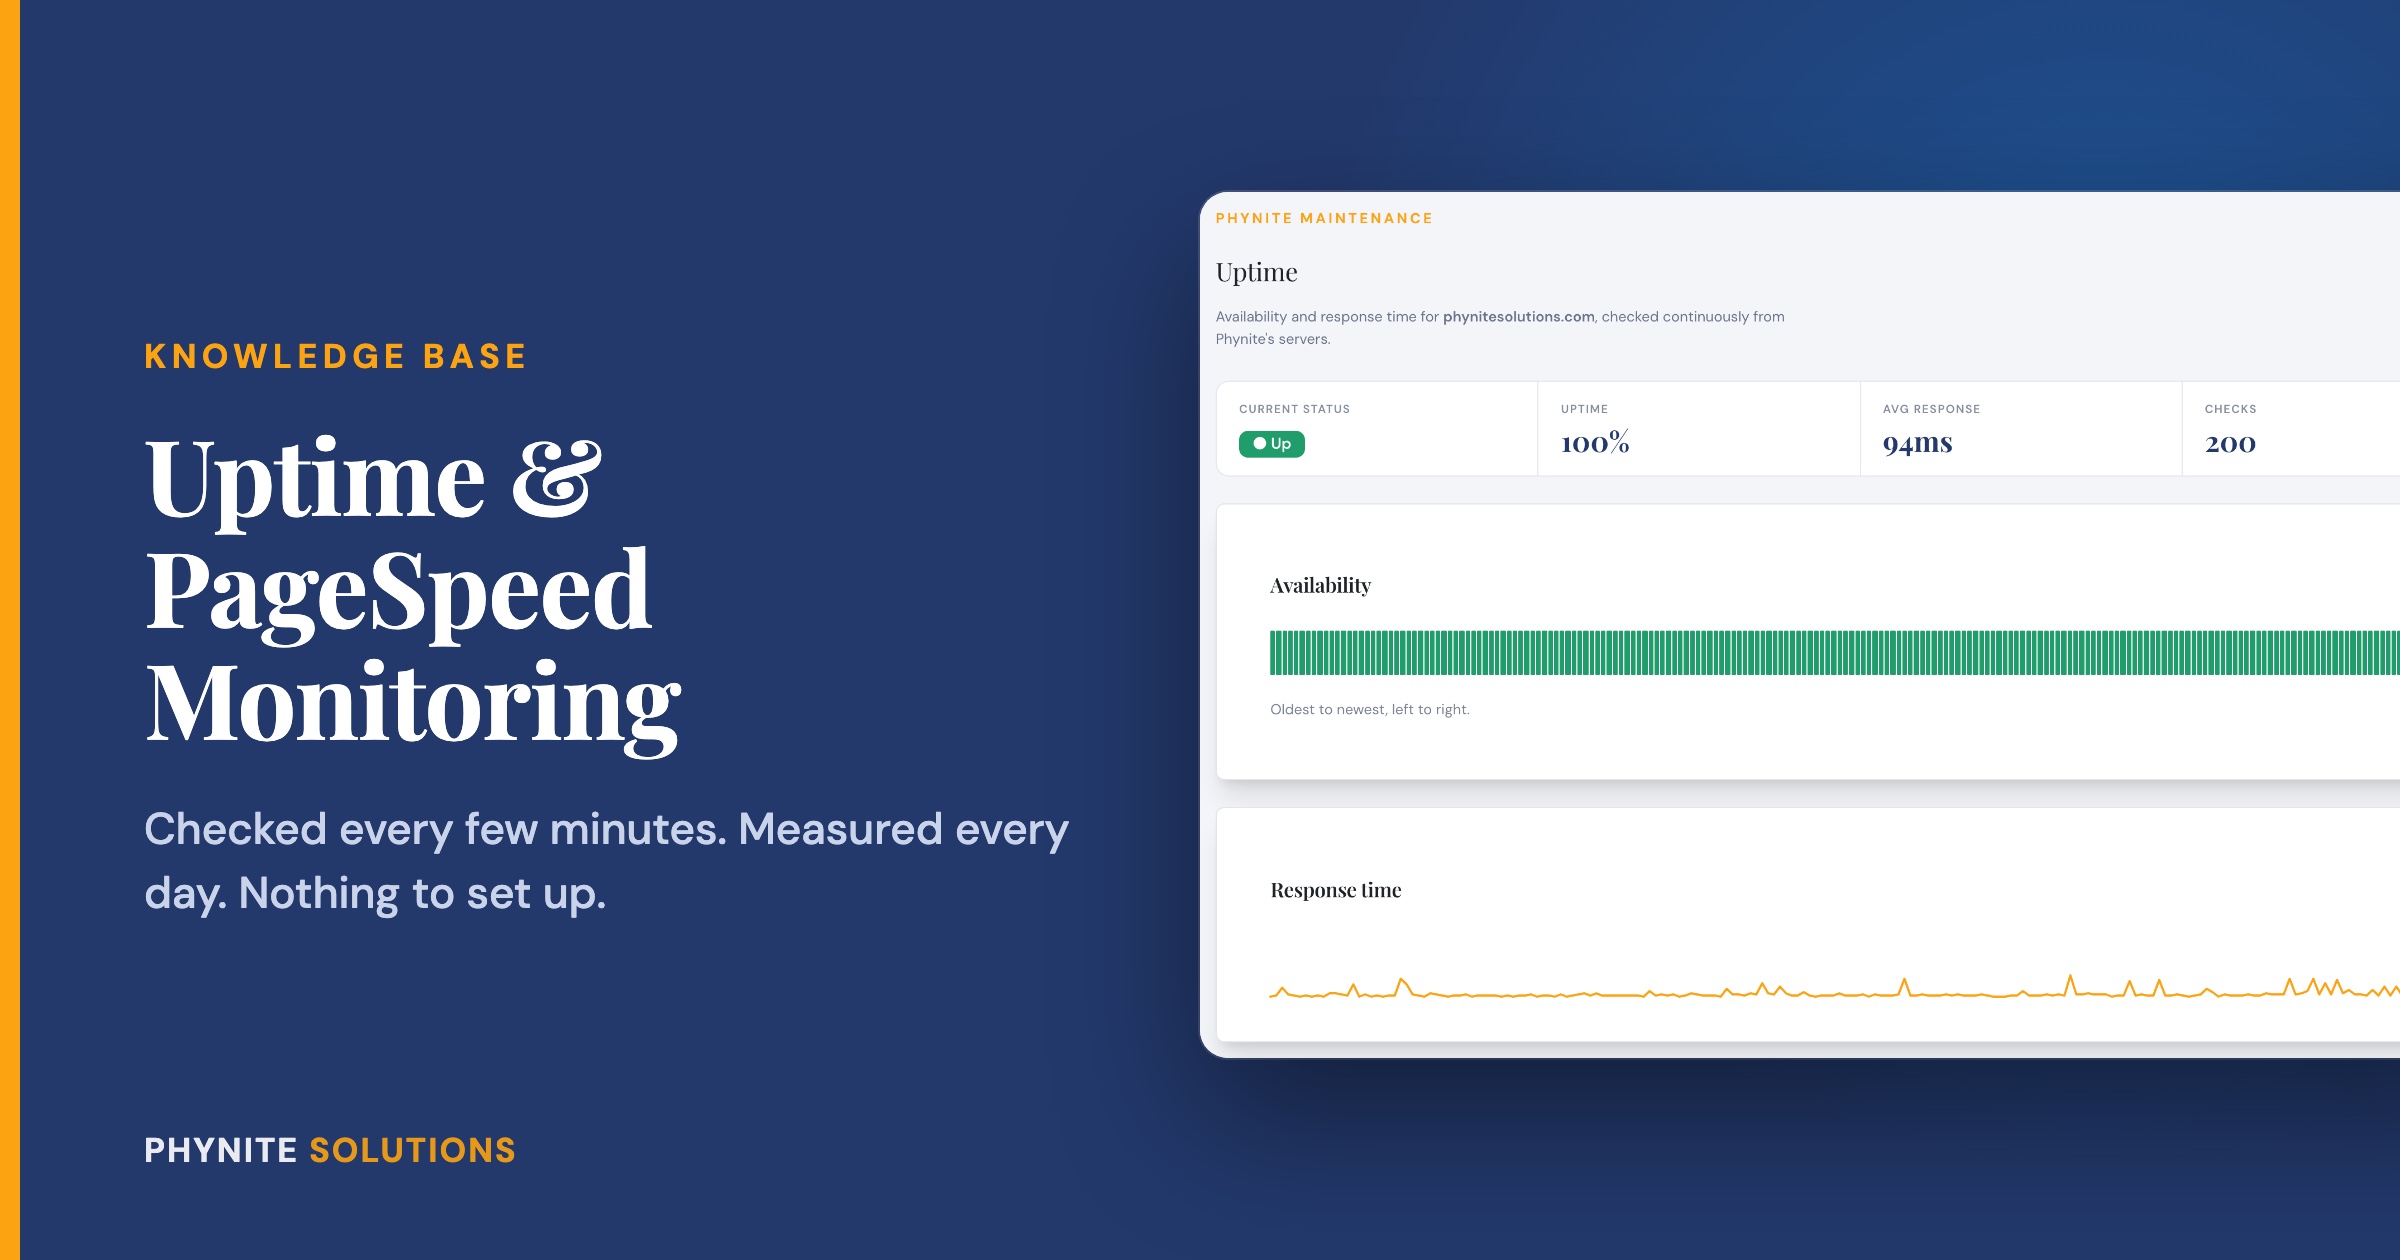
Uptime and PageSpeed Monitoring in Phynite Blog Care
Overview
Phynite Blog Care keeps an eye on two things that matter to every blog: is your site up, and how fast is it. Both are checked automatically, and you can see the results any time from your WordPress dashboard.
There is nothing to configure. Once your site is connected to Phynite (we do that for you when we set up your Blog Care plan), monitoring just starts.
How It Works
Uptime
Every few minutes, Phynite checks your site from our own servers, not from inside your site. That difference matters. A plugin that checks your site from the inside cannot tell anyone your site is down, because when your site is down, so is the plugin. Checking from the outside means we see your site the same way your readers do.
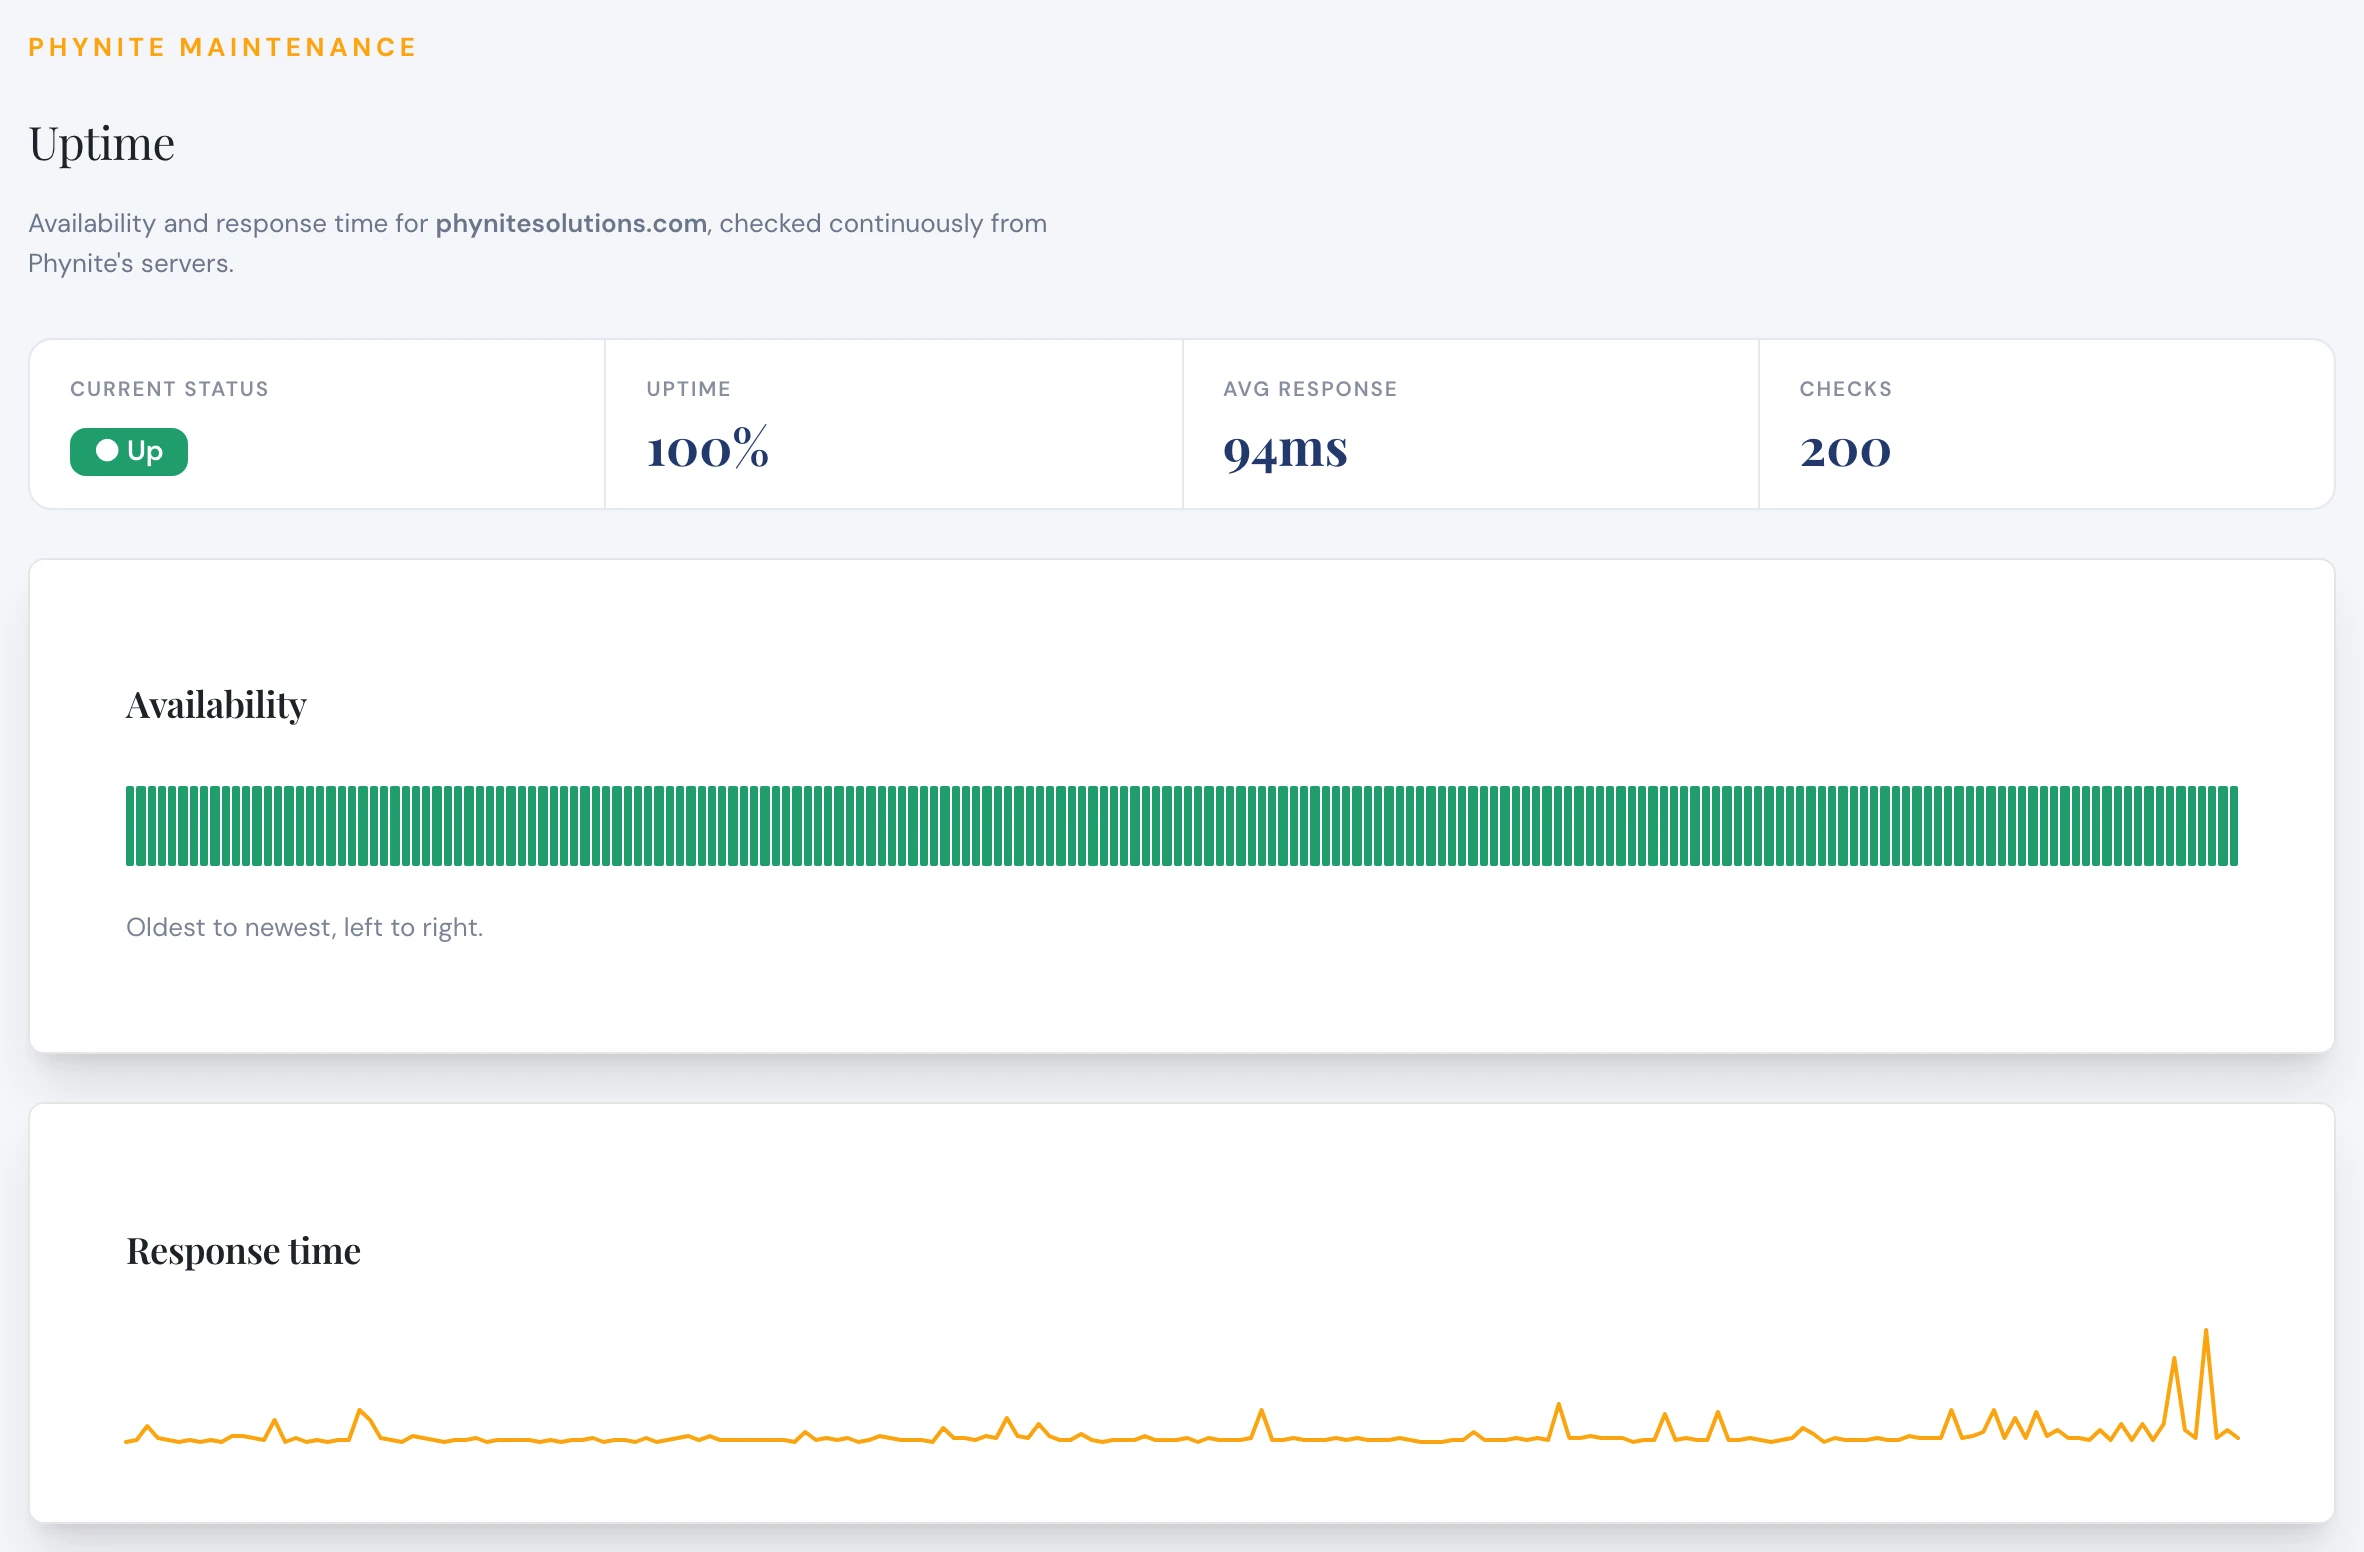
On the Uptime screen you will see:
- Current status: whether your site is up right now
- Availability: the percentage of checks your site passed
- Average response: how quickly your site answers
- Response time chart: how that speed has trended over time
PageSpeed
Once a day, Phynite runs Google PageSpeed Insights against your site on mobile, which is where most of your readers are and how Google judges you. You do not need your own Google API key; we use ours.
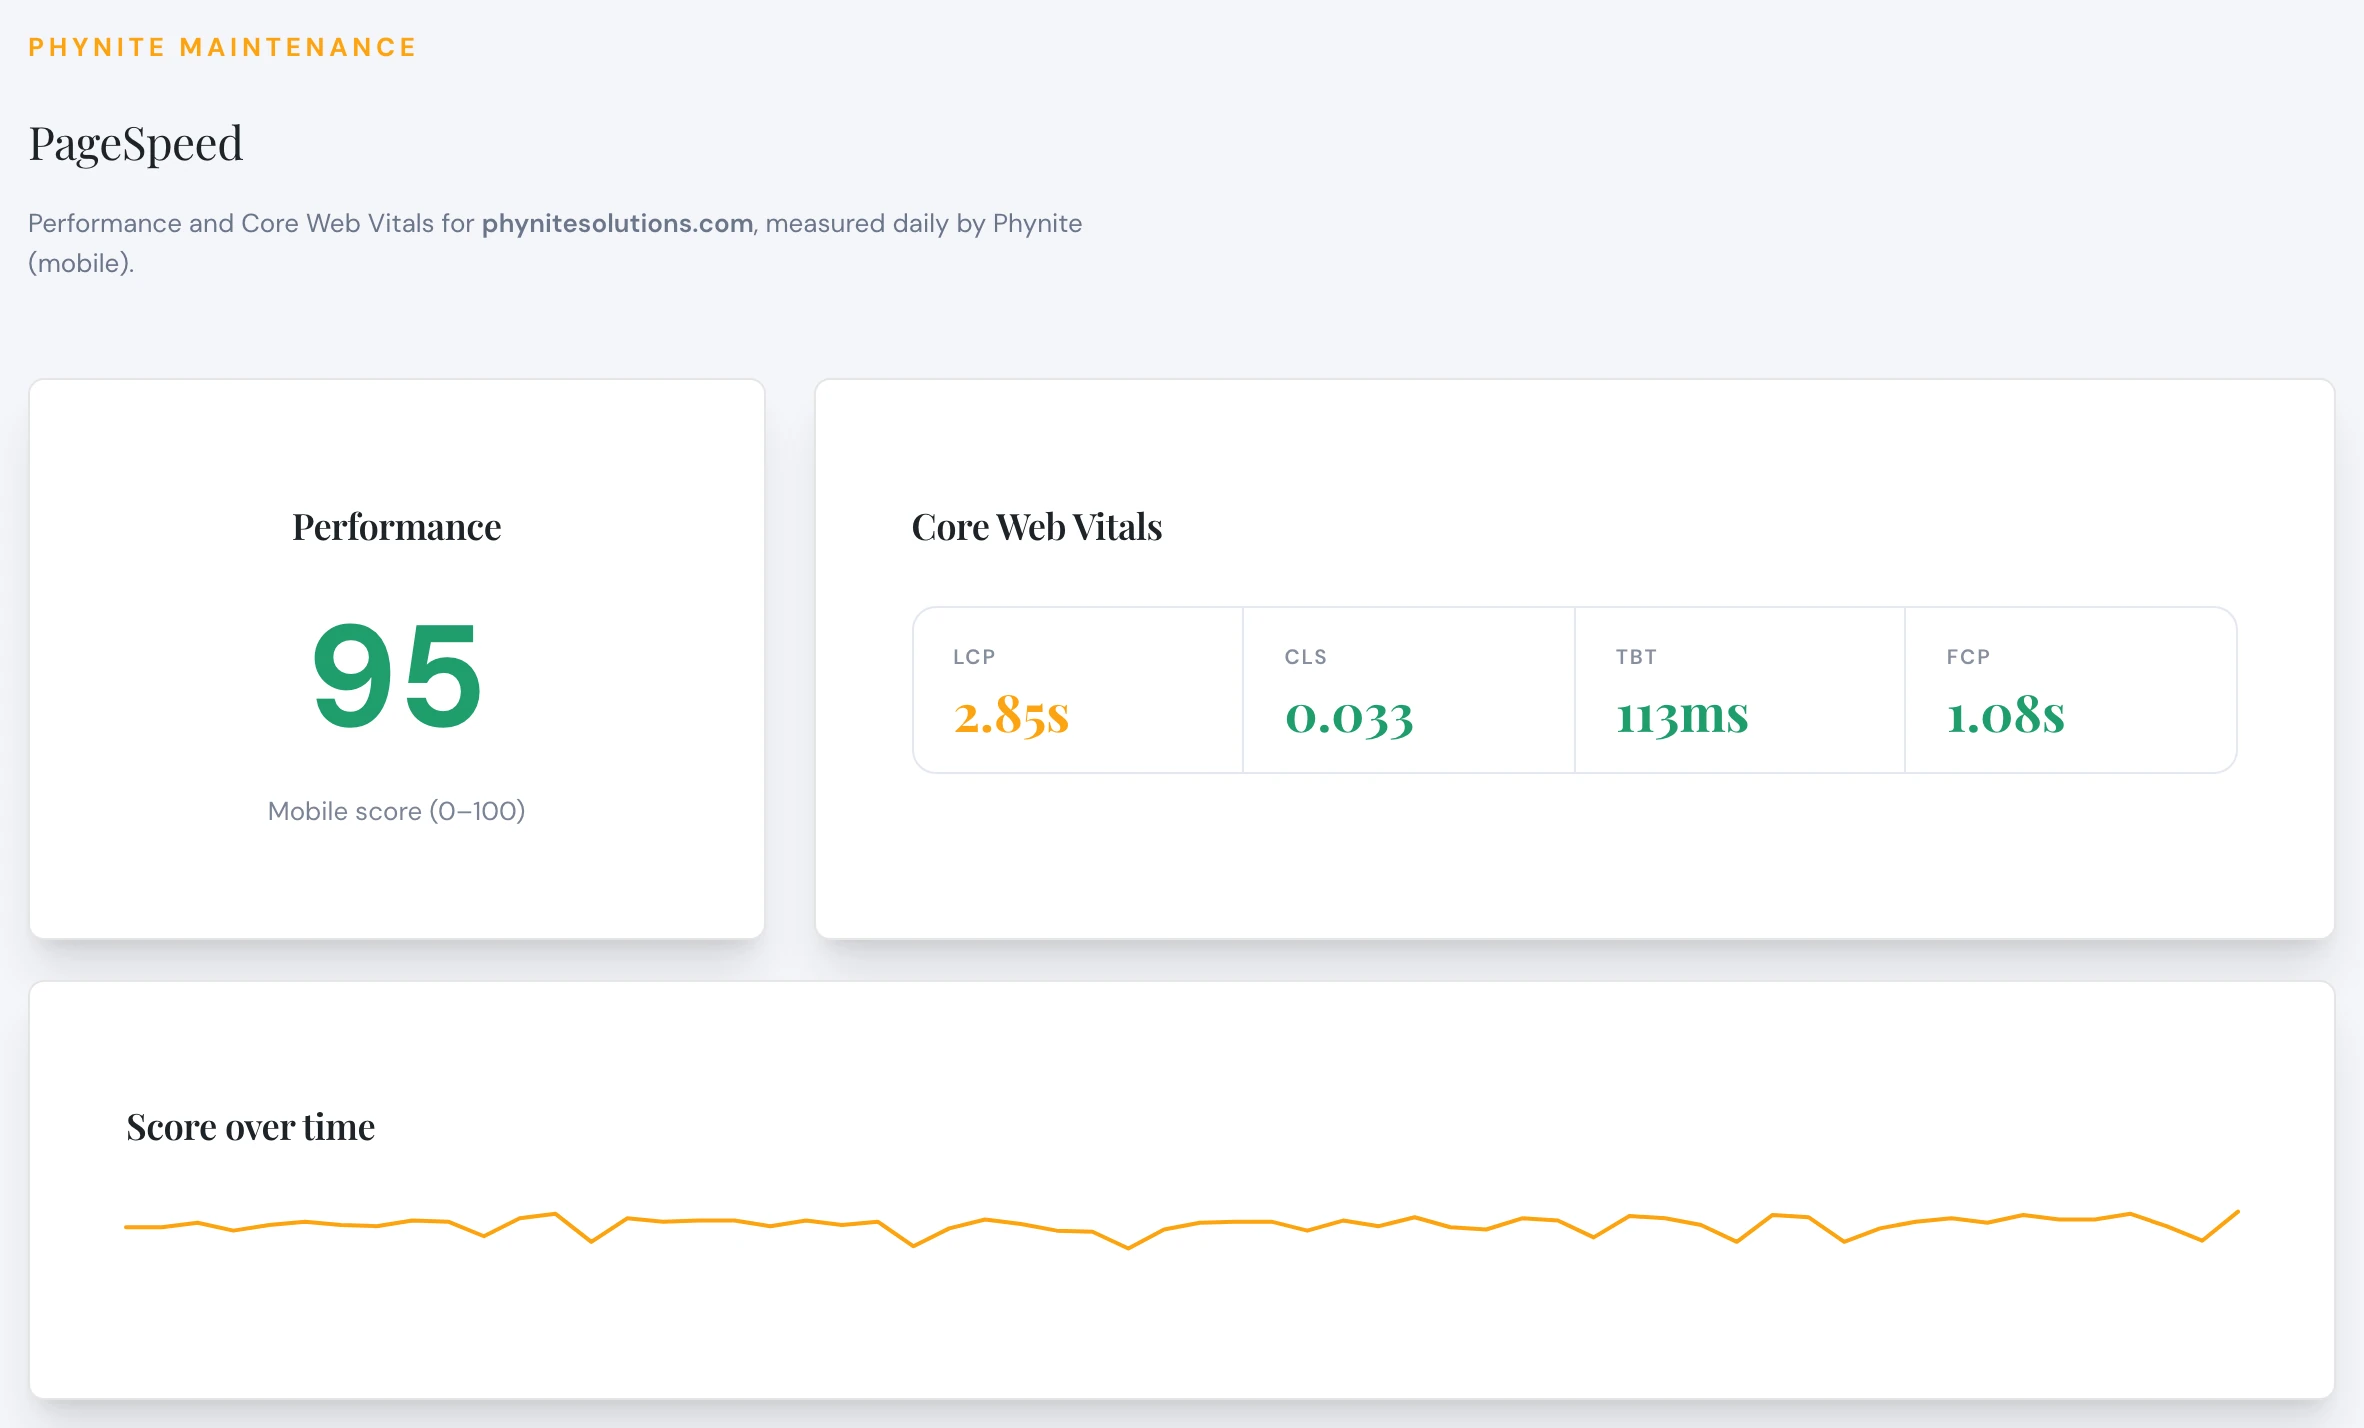
On the PageSpeed screen you will see:
- Mobile score (0–100): Google’s overall performance score
- Core Web Vitals: your loading, interactivity, and visual stability numbers
- Score over time: a chart so you can spot when something changed
Tip: New to Core Web Vitals? Our guide, What are Google Core Web Vitals, explains what each number means and how to improve it.
Keep Up to Date
Get The Phynite Letter: news on our products and services, plus tips and tricks to keep your site running at its best.
Where to Find It
- In your WordPress dashboard, open Phynite Blog Care → Dashboard for a quick look at everything Phynite is watching
- Open Phynite Blog Care → Uptime for availability and response time
- Open Phynite Blog Care → PageSpeed for your score and Core Web Vitals
What to Do With It
Your PageSpeed score dropped
Look at the Score over time chart and note the day it changed. A sudden drop usually lines up with something new: a plugin, a theme update, an ad setting, or a large image on your homepage. Send us the date and we will help track it down.
Your site went down
You do not need to watch for this. We see it on our end. If you notice something is off, reach out to support@phynitesolutions.com and we will dig in.
Troubleshooting
The screens say “Connect this site”
Your site is not connected to Phynite yet. Reach out to support and we will connect it for you.
There is no data yet
Uptime results appear within a few minutes of connecting. PageSpeed runs once a day, so your first report shows up after the next daily run. The score chart needs a few days of history before it can draw a trend.
Frequently Asked Questions
No. Once your site is connected, uptime and PageSpeed monitoring start automatically.
No. Phynite runs PageSpeed Insights for you with our own key.
Most of your readers are on their phones, and Google uses mobile performance when it evaluates your site.
No. The checks run from Phynite’s servers, not inside your site, so your readers never notice them.
Monitoring is part of Phynite Blog Care, included with every Blog Care plan: Tiny Much, Medium Much, and Big Much.